Moving, Home Lab Status, and PowerShell Reporting
Wow, so a lot to cover today. I recently moved out of my parents basement and into my own townhome with the wife and dog! Unfortunately, that means that we're back to paying 100% of the utilities and I'm giving some strong consideration to changing my home lab from an always on to a only-when-I-need-it. I would leave my Synology on for storage/backups, but turn off the HP DL360s and possibly the Avaya switch. New hardware would need to be purchased for routing (currently pfSense is virtual).
Between iLO and Wake On LAN, I think I can come up with something that will enable me to do a single button BAM home lab workflow/automation. More on that later (I swear).
Me Report Pretty One Day
The bulk of this post will be surrounding "pretty" reporting. I rely heavily upon PowerShell for reports - everything from VMware snapshots to UCS Service Profile usage. PowerShell is great for session based reporting (hey Brian, what's the biggest VM storage footprint right now?) but it has a pretty sizable weakness for exporting comprehensive reports in a useful, accessible manner.
Export-CSV
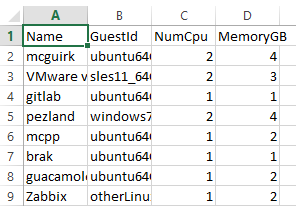
CSVs were the first (and most effortless) way of getting data out of PS, but frankly, they're kind of two dimensional. Let's get all the VMs in my homelab, and report on GuestOS/CPU/memory configuration.
Connect-VIServer vcenter.pezlab.local
$vms = Get-VM

$report = $vms | select Name, GuestId, NumCPU, MemoryGB

$report | Export-Csv c:\temp\report.csv -NoTypeInformation

CSVs don't offer any formatting, no auto-sizing of cells, sorting is a major PITA... and if you want to collect multiple reports in a single file? Not possible (goodbye single "State of VMware" file containing multiple reports on multiple different vCenters).
Excel!
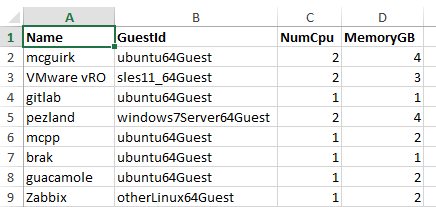
The next iteration in external reporting is Excel - it will handle multiple worksheets (e.g. reports) in a single file, formatting is not only available it can be quite powerful (think heat maps), and Excel can do fancy graphs! However getting data from PowerShell into Excel isn't as easy as you might hope. Hey Scripting Guy has a great article on how to utilize the Excel COM object to directly write data into an xlsx file - but this is both clunky and time consuming (and requires Excel be installed on the system running the script).
Most recently, I've been using ImportExcel. This PowerShell module leverages the EPPlus library to directly create xlsx files without the need for Excel to be installed.
Let's try the same bit of code but exporting the $report variable with Export-Excel:
$report | Export-Excel -Path c:\temp\report.xlsx -WorksheetName "VM Report" -BoldTopRow -AutoSize

This module (and others like it) work quite well, but Excel in general has some downsides:
- Requires Excel for viewing files (pretty much everyone has Excel, but if you're looking to view a report from a Server the chances of Excel being installed is slim).
- Historical report comparison is difficult.
- Only one person can edit an Excel document at a time (and it's very easy to edit/change report data).
- Multiple Excel documents cannot easily be compared (e.g. let's see how a UCS blade relates to a VMware host and what VMs are residing on that host's cluster).
SQL, Visual Studio, and Gridview
One potential solution for each of those downsides to Excel is a web app with database back-end. Complex, historical reports can be pulled via database queries and displayed for multiple concurrent users while making it more difficult for report data to be tampered with. The only requirement for viewing a web page is a browser - something that nearly every modern operating system includes.
For this self-hosted PoC, I installed SQL Server 2014 Express and created a vstest user, a testweb database, and a simple webpage using the Visual Studio template for ASP.NET Web Forms. This time around, I leveraged the Write-ObjectToSQL (I'm not completely sold on this module yet, but it was a quick 'n dirty way to get my data into a table - and it worked so, woo?).
$report | Write-ObjectToSQL -Server localhost\SQLEXPRESS -Database Testweb -TableName vms

I edited the default Visual Studio template content and inserted an asp:GridView tag, then switched to design view to finish configuring the SQL endpoint.

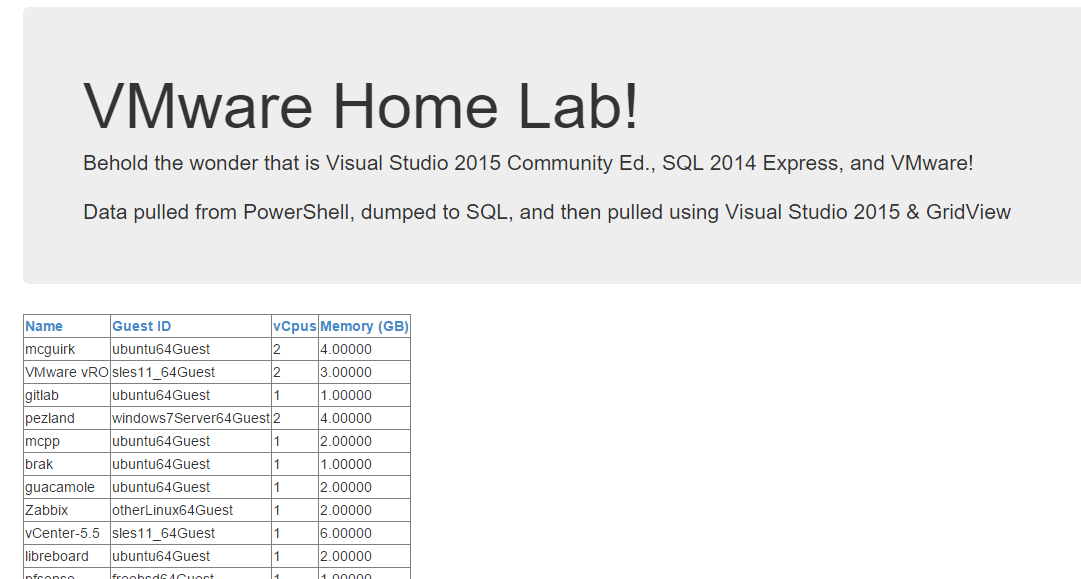
After configuring my data source, I was able to change the headers into something more reasonable, change the column order, and add some general information.
<%@ Page Title="Home Page" Language="C#" MasterPageFile="~/Site.Master" AutoEventWireup="true" CodeFile="Default.aspx.cs" Inherits="_Default" %>

<asp:Content ID="BodyContent" ContentPlaceHolderID="MainContent" runat="server">

    <div class="jumbotron">
        <h1>VMware Home Lab!</h1>
        <p class="lead">Behold the wonder that is Visual Studio 2015 Community Ed., SQL 2014 Express, and VMware!</p>
        <p>Data pulled from PowerShell, dumped to SQL, and then pulled using Visual Studio 2015 & GridView</p>
    </div>
    <asp:GridView Id="vms" runat="server" AutoGenerateColumns="False" DataSourceID="SqlDataSource1" AllowSorting="True">
        <Columns>
            <asp:BoundField DataField="Name" HeaderText="Name" SortExpression="Name" />
            <asp:BoundField DataField="GuestId" HeaderText="Guest ID" SortExpression="GuestId" />
            <asp:BoundField DataField="NumCpu" HeaderText="vCpus" SortExpression="NumCpu" />
            <asp:BoundField DataField="MemoryGB" HeaderText="Memory (GB)" SortExpression="MemoryGB" />
        </Columns>
    </asp:GridView>
<asp:SqlDataSource ID="SqlDataSource1" runat="server" ConnectionString="<%$ ConnectionStrings:TestwebConnectionString %>" SelectCommand="SELECT [GuestId], [MemoryGB], [Name], [NumCpu] FROM [vms]"></asp:SqlDataSource>
</asp:Content>
The final result can be seen here in a screengrab:

What's Next?
Although this is working in my very limited PoC, it is working! My next steps will be to figure out:
- How should the final reporting page work? (Do I want individual URLs for UCS & VMware, or one reporting URL to rule them all?)
- How will I handle stored credentials for my automated PowerShell scripts to talk to SQL?
- How will this translate to a more production-esque deployment?